
Are you ovulating?
When I was first learning how to track my cycles, I remember finally figuring out how to identify my temperature shift and draw a coverline. I felt like I was cracking a master code!
The 2 skills that you'll need to master in order to feel confident about confirming ovulation has occurred are:
identifying a temperature shift has occurred
drawing a coverline
Below are the guidelines I use when teaching the single check sympto-thermal method (STM) of fertility awareness. If you learned to track your cycle using a different method, the coverline and temp shift guidelines may be slightly different.
What is a temperature shift?
A temperature shift is a slight rise in your basal body temperature that occurs because of a release of the hormone progesterone.
A temperature shift ONLY happens due to the presence of progesterone which is secreted only if ovulation has occurred.
If ovulation has not happened, the corpus luteum (which holds the egg) never forms and thus does not release progesterone.
This means you won’t see a temperature shift if you have not ovulated.
When estrogen is more dominant = temperatures are lower
When progesterone is more dominant= temperatures rise
PRO TIP= if you have a few charts under your belt, look back at these cycles and see what your typical range of temperatures are during your follicular phase (before you ovulated) and what they are after you've ovulation (in your luteal phase). This can help you tune into what your typical ranges are so you can more clearly see your unique temperature pattern.

This is an image of a completely filled out paper chart. Do you want to explore paper charting? You can download one here.
What is a coverline?
A line that divides your chart into 2 distinct temperature ranges.
Your preovulatory temps (during your follicular phase) and your postovulatory temps (during your luteal phase)
A coverline helps you visually confirm the temperature shift that signals ovulation has occurred
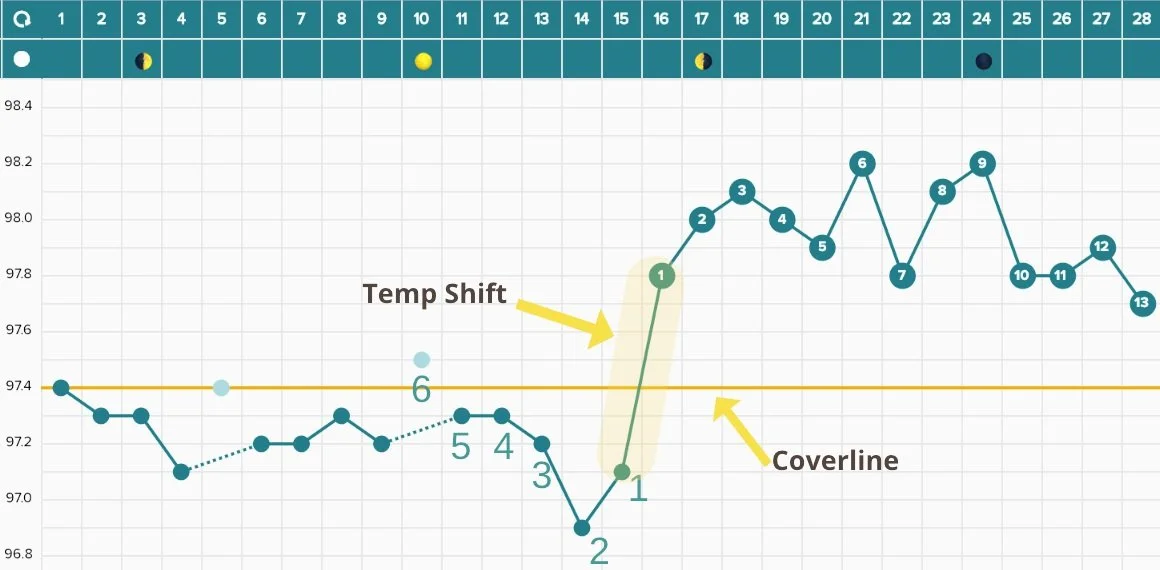
How to identify your temperature shift and draw a coverline (Fahrenheit)
The temp shift is the first day your temperature rises at least 2/10ths of a degree (.2 °F) or 2 graph spaces higher than the temperatures you’ve taken in the last 6 DAYS
Within the 6 days prior to your temp shift, you must have at least 4 temps recorded
Find the highest temperature among those 6 days.
Draw a line 1/10th of a degree (.1 °F) or 1 graph space above the highest temperature among those 6 days.
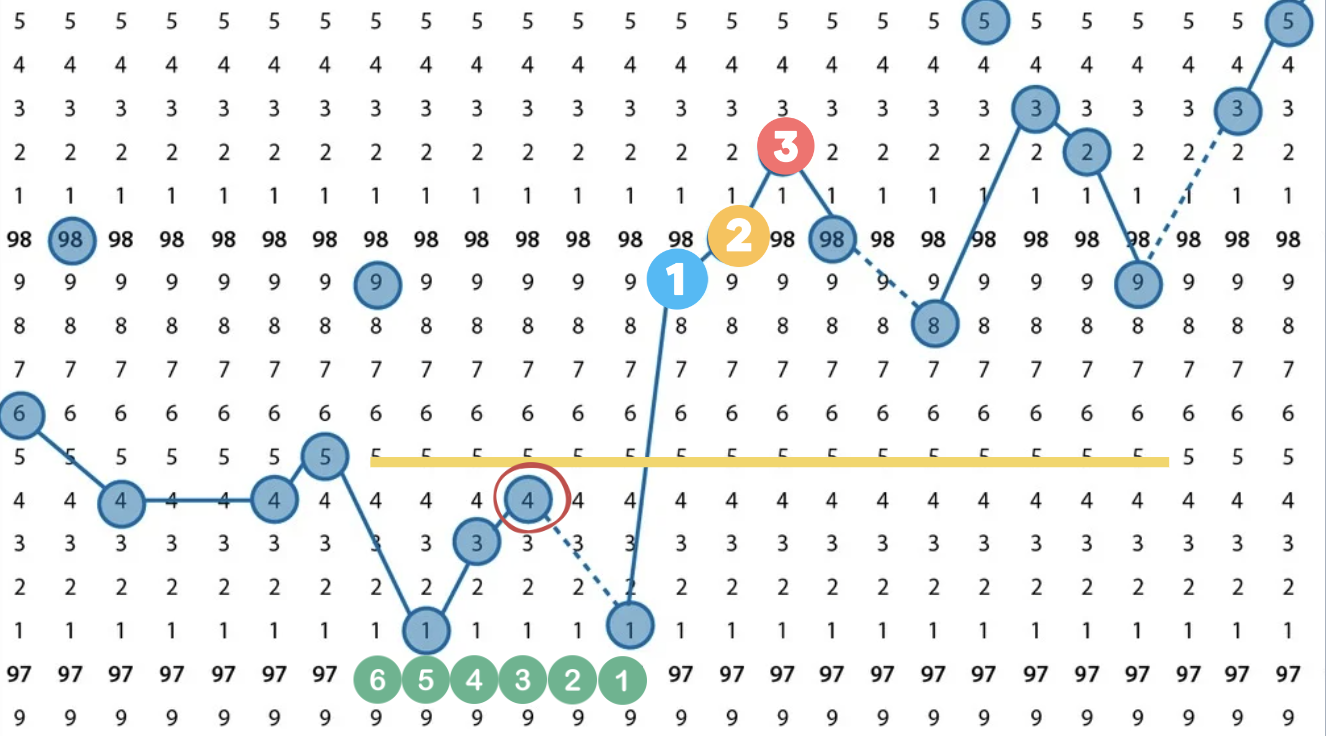
The temp shift occurred in this chart when the temp rose from 97.1 to 97.9, which was more than 2/10ths of a degree higher than the last 6 days. The green bubbles identify the 6 days before the temp shift occurred. During those 6 days, this charter missed taking 1 temp (dashed lines) and then omitted one temp on the 6th day. They still have 4 accurate temperatures so they can draw there coverline. The highest temp within the 4 included temperatures was on 97.4 (circled in red), so the coverline is placed just above this high temperature on 97.5.
In order to confirm ovulation, you'll want your temperatures to stay high above your coverline.
How to identify your temperature shift and draw a coverline (Celsius users)
Temp shift is the first day your temperature rises at least 1/10th of a degree (0.1 °C) or 2 graph spaces higher than the temperatures you’ve taken in the last 6 DAYS
Within the 6 days prior to your temp shift, you must have at least 4 temps recorded
Find the highest temperature among those 6 days.
Draw a line 0.05 °C above the highest temperature or 1 graph space above the highest temperature among those 6 days.
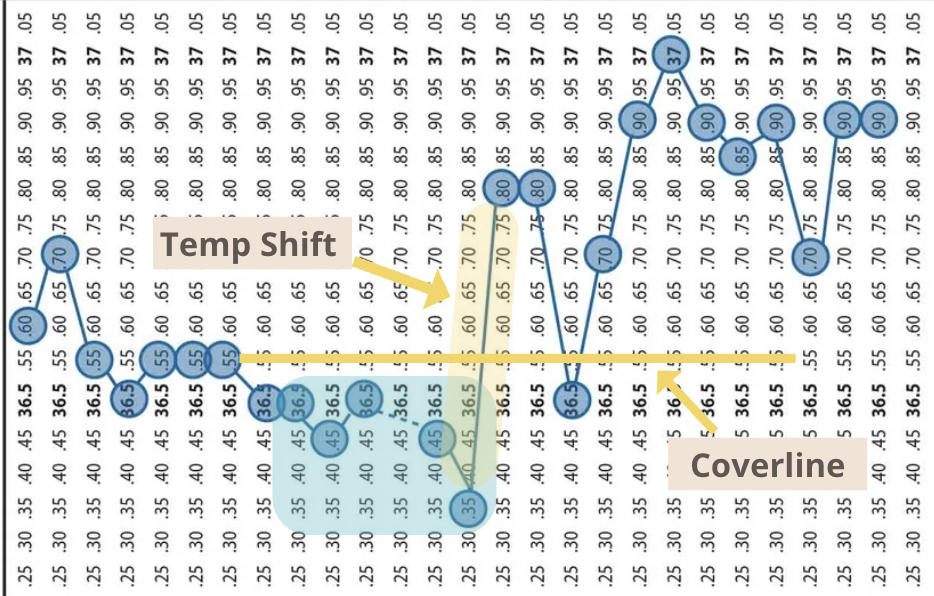
The temp shift occurred in this chart when the temp rose from 36.35 to 36.8, which was more than 1/10th of a degree higher than the last 6 days. The blue square identifies the 6 days before the temp shift occurred. During those 6 days, this charter missed taking 1 temp (dashed lines). They still have 5 accurate temperatures so they can draw there coverline. The highest temp within the 5 included temperatures was on 36.5, so the coverline is placed just above this high temperature on 36.55
In order to confirm ovulation, you'll want your temperatures to stay high above your coverline. Above is an example of a fall back rise, which is common. This is why the guideline is 3 high temps within 4 days of your temperature rise, so this charter would be able to confirm ovulation using their temperatures. Remember you are also doing a cross check with your vaginal secretions as well.
Key Takeaways:
id your temp shift by looking for a temperature that is at least 2 graph spaces higher than the last 6 days
you need at least 4 accurate temps to draw a coverline
find the highest temperature within those 6 days draw your coverline 1 graph space above the highest